Charts
Charts can be created with the New-UDChart cmdlet. Charts can be either bar, line, doughnut or pie. Chart data is supplied via a server-side PowerShell snippet. Charts can be extensively customized. This includes colors, borders and any option that the ChartJS library provides.
Creating a basic chart
A basic chart can be created by specifying the Title, Type and Endpoint.
New-UDChart -Title "Threads by Process" -Type Doughnut -RefreshInterval 5 -Endpoint {
    Get-Process | ForEach-Object { [PSCustomObject]@{ Name = $_.Name; Threads = $.Threads.Count } } | Out-UDChartData -DataProperty "Threads" -LabelProperty "Name"
} -Options @{
     legend = @{
         display = $false
     }
   }
The above script would result in the below chart.
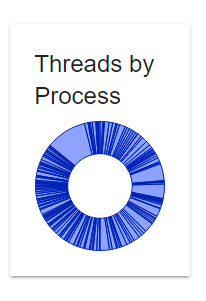
The data in the chart is the number of threads per process name. Chart data is returned from an Endpoint using the Out-UDChartData cmdlet. It formats the chart data as JSON and in a format that the client-side JavaScript understands. It's required to supply a DataProperty and a LabelProperty. The DataProperty is the Y-axis in a line or bar chart and the LabelProperty is the X-axis.
Additional options can be supplied to the chart control via the Options parameter. It should be a hashtable with ChartJS options for the specified chart. Charts can also AutoRefresh at a specified interval. The RefreshInterval is the number of seconds between refreshes.
Creating charts with multiple datasets
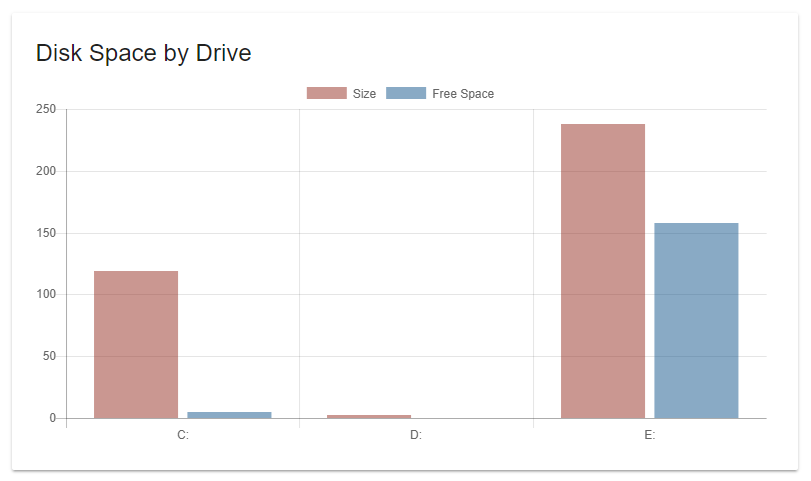
To create charts with multiple datasets, use the Out-UDChartData parameter set that accepts an array of datasets created by New-UDChartData set. Each dataset selects a different dimension of data from the supplied object. An example would be selecting the Total Size and Free Space from the disk drives on a computer.
New-UdChart -Title "Disk Space by Drive" -Type Bar -AutoRefresh -Endpoint {
  Get-CimInstance -ClassName Win32_LogicalDisk | ForEach-Object {
          [PSCustomObject]@{ DeviceId = $_.DeviceID;
                        Size = [Math]::Round($_.Size / 1GB, 2);
                        FreeSpace = [Math]::Round($_.FreeSpace / 1GB, 2); } } | Out-UDChartData -LabelProperty "DeviceID" -Dataset @(
       New-UdChartDataset -DataProperty "Size" -Label "Size" -BackgroundColor "#80962F23" -HoverBackgroundColor "#80962F23"
       New-UdChartDataset -DataProperty "FreeSpace" -Label "Free Space" -BackgroundColor "#8014558C" -HoverBackgroundColor "#8014558C"
   )
 }
}
The New-UDChartDataset cmdlet expects the DataProperty and Label of the dataset you are creating. You can easily select colors and border styles for the chart. The above example would produce the following chart.