When developing a dashboard it may become necessary to debug an endpoint. Endpoints are run within the Universal Dashboard server in a different runspace than the runspace you used to start the dashboard. Because of this, it can become difficult to determine an error that may be preventing data from appearing in your dashboard. Terminating errors should result in the UD card displaying the error message but non-terminating errors or unexpected behavior may not be reflected at all in the user interface.
DebugEndpoint Parameter
Required Version: 1.3.0-beta1 or later
By default, an endpoint can run in any number of runspaces hosted within Universal Dashboard. This can make it difficult to attach to the correct runspace for debugging. Using the DebugEndpoint parameter of any cmdlet exposing an Endpoint parameter, you can ensure that the execution of that endpoint happens in the UDDebug runspace.
The first step is to ensure you have the DebugParameter specified on your cmdlet.
New-UDCounter -DebugEndpoint -Title "Count Value" -Endpoint {
    $RandomValue = Get-Random
    $RandomValue += 1
    $RandomValue
}
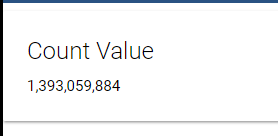
Next, load the dashboard in your browser. You can see here, I have a random value showing in my UDCounter.
If we execute Get-Runspace, you'll see that there is a UDDebug runspace defined. Since we used DebugEndpoint on UDCounter, any execution of our endpoint for the counter will be in this runspace.
PS C:\Users\Adam> Get-Runspace

 Id Name            ComputerName    Type          State         Availability
 -- ----            ------------    ----          -----         ------------
  1 Runspace1       localhost       Local         Opened        Busy
  2 UDDebug         localhost       Local         Opened        Available
Using Debug-Runspace, we can attach to this runspace and begin debugging it.
PS C:\Users\Adam> Debug-Runspace -Name UDDebug
Debugging Runspace: UDDebug
To end the debugging session type the 'Detach' command at the debugger prompt, or type 'Ctrl+C' otherwise.
Reload the dashboard page and the debugger will break in the Endpoint code. You can see we are stopped on the first line in the Endpoint script block.
Entering debug mode. Use h or ? for help.

At line:2 char:1
+ $RandomValue = Get-Random
+ ~~~~~~~~~~~~~~~~~~~~~~~~~
[DBG]: [Process:20472]: [UDDebug]: PS C:\Users\Adam>>
You can use commands like 'l' to list the source of the current Endpoint.
[DBG]: [Process:20472]: [UDDebug]: PS C:\Users\Adam>> l


    1:
    2:* $RandomValue = Get-Random
    3:  $RandomValue += 1
    4:  $RandomValue
    5:
If you want to step to the next line, use the 'v' command.
[DBG]: [Process:20472]: [UDDebug]: PS C:\Users\Adam>> v
At line:3 char:1
+ $RandomValue += 1
+ ~~~~~~~~~~~~~~~~
You get the value of the $RandomValue variable.
[DBG]: [Process:20472]: [UDDebug]: PS C:\Users\Adam>> $RandomValue
89736542
Debugging the return value of an endpoint from the browser
Sometimes the serialization of an object may not go as expected. To see what is returned by the server to the web browser, you can specify the endpoint URL in the browser address bar or use the F12 developer tools in your browser.
Finding the correct URL
Assuming we have a UDCounter, we can determine the result of that counter by finding the request in the browser developer tools.
The easiest way to find a URL is to ensure that is has an easy to find ID. If the ID isn't specified then the component's ID is a randomly generated GUID. It will remain the same for the duration of the execution of the UDDashboard but recreating a dashboard via New-UDDashboard will regenerate this GUID.
Debugging an endpoint from the browser
Here's an example of specifying an ID.
New-UDCounter -ID RandomCounter -Title "Count Value" -Endpoint {
    $RandomValue = Get-Random
    $RandomValue += 1
    $RandomValue
}
In Chrome, you can press F12 on the dashboard to open the developer tools. Navigate to the Network tab and press F5 to reload the page. You will have request to the endpoint by that ID.
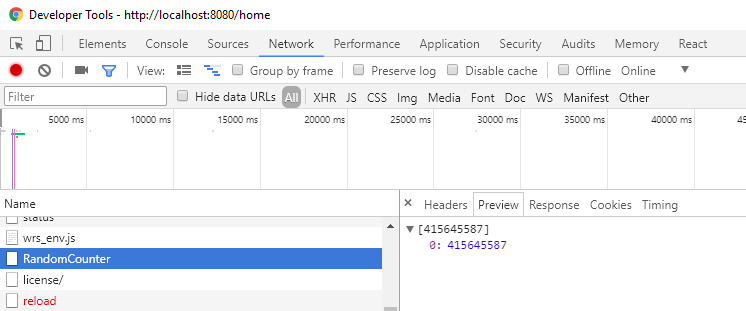
You can see above that in the preview of the response, my random value is being returned.
Finally, you can also go directly to the Endpoint by visiting the URL directly.
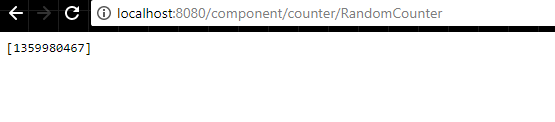
Each type of component has a different endpoint. Below is a list of component endpoints
- UDCounter - /component/counter/<id>
- UDCollapsible - /component/collapsible/<id>
- UDChart - /component/chart/<id>
- UDTable - /component/chart/<id>
- UDRow - /component/row/<id>
- UDColumn - /component/column/<id>
- UDGrid - /component/grid/<id>